
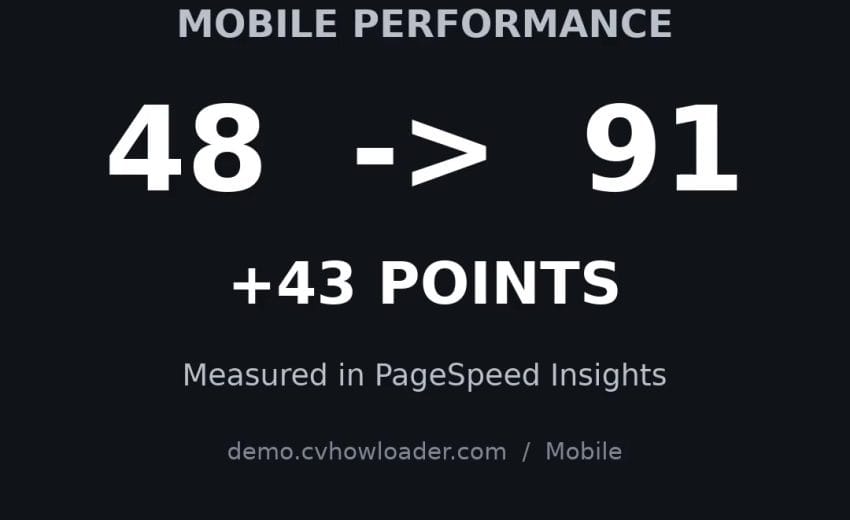
A website can look fast. That’s not the same as being able to prove it. Here’s the website performance audit method we use before we’ll put a number on anything.
Table of Contents
Why “It’s Faster Now” Isn’t Proof
Every developer has said it at some point: “the site is faster now.” It’s an easy sentence to say and, on its own, a hard one to back up.
A single test run, a screenshot taken at a lucky moment, a round number reported without context — none of that is evidence. It’s marketing dressed up as data. And it’s exactly the gap a proper website performance audit is supposed to close.
The video above walks through a small, deliberate exercise on one of our own WordPress builds: running the same test twice, under controlled conditions, and being honest about what the numbers do and don’t show.
What a Real Website Performance Audit Looks Like
A website performance audit isn’t a single click on a testing tool. It’s a process with a few non-negotiable parts:
- A fixed URL, tested under the same conditions each time
- A named tool, so results are checkable by anyone (we used Google PageSpeed Insights)
- A timestamp on every report
- A record of what changed between tests — including things like cache state, not just code
Skip any of these and a “performance report” becomes a screenshot with a nice number on it — not evidence.
The Two-Report Method: How We Test for Reproducibility
For this audit, we ran a mobile PageSpeed Insights test against a live WordPress site, waited a few minutes, and ran the exact same test again against the same URL.
Two separate, timestamped reports. Same page. No cherry-picking the better result and throwing away the worse one.
Why bother running it twice? Because a result that only shows up once isn’t a result — it’s a coincidence. If a “before and after” comparison can’t be reproduced, it doesn’t belong in a website performance audit, no matter how good the numbers look.
This is a small thing to add to any performance workflow, and it’s the single biggest difference between a claim and a proof point.
Clearing the Cache Between Tests (and Why It Matters)
Between the two test runs, we purged the site’s caching layers — Cloudflare’s edge cache and the server-side cache — before re-running the test.
This matters because caching can flatter a result. A page served entirely from cache on a second load isn’t being tested the same way a first-time visitor experiences it. If you don’t control for cache state, you’re not testing performance — you’re testing the cache.
For any WordPress performance optimization work, this is a step that’s easy to skip and important not to. A credible website performance audit documents cache state as carefully as it documents the score.
Reading Google PageSpeed Insights and Core Web Vitals Correctly
PageSpeed Insights reports on Core Web Vitals — Google’s metrics for real-world page experience:
- LCP (Largest Contentful Paint) — how long the main content takes to appear
- INP (Interaction to Next Paint) — how responsive the page feels once someone starts interacting with it
- CLS (Cumulative Layout Shift) — how much the page jumps around while loading
A single overall score is a summary, not the full story. A proper website performance audit looks at the underlying Core Web Vitals individually, on both mobile and desktop, because a site can score well on one and poorly on another.
The “No Data” label you’ll sometimes see next to the field data section isn’t a failure — it usually means the site hasn’t yet collected enough real-user traffic in Google’s Chrome User Experience Report. It’s a data-availability note, not a performance verdict, and it’s exactly the kind of detail that gets lost when someone just screenshots a score.
What “Evidence Before the Claim” Means for Your Website
If you commission a “we made it faster” fix from a developer or an agency, it’s fair to ask:
- Can you show me both reports, not just the “after” one?
- Was the cache cleared before the second test?
- What tool was used, and can I run it myself?
If the answer to any of those is a shrug, the claim hasn’t actually been tested — it’s been asserted. That distinction is the whole point of treating a website performance audit as a discipline rather than a one-time favor.
A Simple Checklist You Can Use on Your Own Site
You don’t need an agency to start doing this. Here’s the short version:
- Pick one page and one tool — start with PageSpeed Insights, since it’s free.
- Run the test, save the timestamped report.
- Make one change.
- Clear every layer of cache (browser, CDN, server, plugin).
- Run the exact same test again and compare both reports side by side.
Do this consistently and you’ll have a genuine record of what actually improved — not a guess dressed up as a result.
Final Thoughts: Measure, Improve, Prove
The framework behind this whole exercise is simple: Measure → Improve → Prove. Evidence before the claim, every time.
That’s the standard we hold our own WordPress performance optimization work to as a Laravel & WordPress developer — measure before touching anything, make the change, then measure again under matching conditions. If the data doesn’t support the claim, the claim doesn’t get made.
If you’re dealing with a slow WordPress site and want a website performance audit that shows its work rather than just its conclusion, get in touch — most fixes turn around within 48 hours.
Further reading: Google’s Web Vitals documentation covers each Core Web Vital in technical detail. See also our WordPress rescue services for related fixes.

September 8, 2026
Scaling App: Professional Laravel and React Integration Standards
September 8, 2026